Raise the barriers Scale new heights
According to the latest U.S. energy storage monitoring report released by the American Council for Clean Energy (ACP) and Wood Mackenzie, in 2022, the U.S. will add 4,798MW/12,181MWh of new energy storage capacity, a year-on-year increase of 34%/12%. The installed capacity of the system reaches 8842MW/11105MWh.
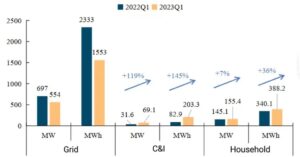
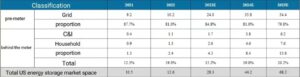
From the perspective of market segments, in Q1 2023, the installed capacity of the three major US grid-level energy storage/industrial and commercial and community energy storage/household energy storage markets will reach 554MW/1553MWh,69.1MW/203.3MWh, and 155.4MW/388.2MWh respectively. The capacity ratio is 71.2%/8.8%/19.9% respectively.
As the penetration rate of new energy increases, energy storage is used as a means of power balance, and the rigid demand increases. In May 2023, after the implementation of the IRA rules, the wait-and-see sentiment in the energy storage market has weakened, and the peak installed capacity in the second half of the year will drop. In 2023, the installed capacity of the energy storage market is expected to reach 28.3GWh.
Development driving force
The price of electricity remains high, the penetration rate of new energy increases, and the rigid demand for energy storage increases.
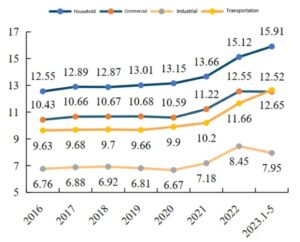
In recent years, electricity prices for American residents have remained high, rising from 13.66 cents/kWh in 2021 to 15.91 cents/kWh from January to May 2023, an increase of 16.5%. At the same time, most regions have liberalized the electricity market, and the price of electricity varies greatly.
According to the U.S. Energy Information Administration’s Electric Power Monthly Report, from January to May 2023, the full-scale net power generation in the United States was 1,615.697 billion kWh, a year-on-year decrease of 3.5%, and the decline was 0.2 pct higher than that from January to April. From the perspective of power generation, on the basis of reduced electricity consumption, solar power still increased by 11.9% year-on-year.
As solar capacity comes online, two challenges arise.
One is the pressure on the grid. Energy demand is high from noon to late at night, but solar power generation is gradually shrinking, and it is difficult for grid operators to match grid supply and demand in real time. In addition, operators also need to ensure that the amount of solar power generated is less than the amount used by the grid to prevent excessive power generation.
The second is economical. Reduced time for conventional power plants, resulting in reduced energy revenues, changes to the economics of dispatchable power plants, where plants face decommissioning in the absence of dispatchable replacements, critical for grid balance in systems with large fluctuations in net demand The demand for power supply and demand will increase.
Plus, two-thirds of North America is at risk of energy shortages as temperatures continue to soar this summer, according to an analysis by the North American Electric Reliability Corporation (NERC). Therefore, as the penetration rate of new energy increases, the rigid demand for energy storage will increase accordingly.
Regional power grids are independent of each other, and energy storage assists large-scale cross-regional dispatching.
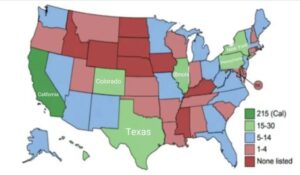
The regional differentiation of the US energy storage market is obvious, mainly concentrated in California and Texas.
As of 2021, the installed capacity of energy storage in California is 2339.1MW, accounting for 44%; the installed capacity of energy storage in Texas is 797.4MW, accounting for 15%. The rapid development of California and Texas is mainly related to factors such as unstable power infrastructure and obvious policy incentives.
At present, energy storage in the US is mainly composed of three major power grid groups: the Eastern Union Grid, the Western Union Grid and the Texas Grid. The three major power grids are relatively independent.
Because the UHV technology in the US has not been widely used, and the distance is too long and the loss is too large, the power grid group is unwilling to carry out interstate power transmission, so each operates independently, and it is difficult to carry out large-scale cross-regional dispatch. Therefore, power auxiliary services are needed to help complete consumption, and the installed capacity of energy storage on the power generation side and the grid side has increased significantly.
Aging power equipment, unbearable to extreme weather.
Due to the long period of time for the layout of the US power grid, the line layout is relatively complicated. In the context of power privatization, companies are unwilling to invest too much money in upgrading and maintaining the power grid system, which leads to aging equipment and prone to power outages when encountering slightly extreme weather.
According to the White House, more than 70 percent of the current electricity grid in the US was built in the 1960s and 1970s and is more than 25 years old. In 2021, U.S. electricity customers experienced an average of more than 7 hours of power outages, compared with about 8 hours in 2020, with Louisiana having the longest outage of 80 hours in 2021.
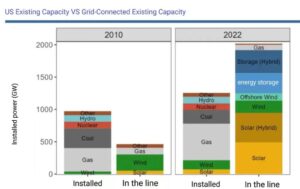
In January 2022, the U.S. Department of Energy (DOE) launched the “Building a Better Grid” initiative. The program aims to strengthen the resilience of the U.S. electric grid to climate change and increase the use of affordable and reliable clean energy. It is estimated that by 2030, the US will need to expand the transmission system by 60%, and by 2050 it is expected to need to triple the existing capacity.
After the implementation of the IRA rules, the wait-and-see mood of enterprises has decreased.
In August 2022, the US passed the IRA bill. After the bill was issued, the ITC was extended for ten years at a rate of 30%, and gradually declined after 2033. The ITC tax credit for solar-storage systems has been increased from 26% to 30%, and the period has been extended for 10 years. For the first time, independent energy storage is allowed to be included in the scope of subsidies, which will increase the enthusiasm for energy storage market installation.
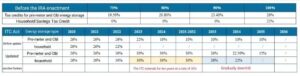
In May of this year, the United States issued IRA calculation rules. There are two forms of subsidy: ITC or PTC, of which only ITC is applicable for independent energy storage. In the first year of project operation, a one-time 30% investment credit can be obtained. If the project meets the requirements of the incentive accounting rules, an additional 10% investment credit can be obtained, and the proportion of the credit amount can be increased to 40%.
According to Wood Mackenzie’s forecast, the US energy storage market will expand by 20%-25%. The CAGR of the off-meter energy storage market will reach 58% from 2022 to 2025, and the compound growth rate of the off-meter energy storage market will reach 51% from 2022 to 2025.
Grid connection process reform, queuing congestion gradually slowed down.
 In February 2022, three coalitions of clean energy industry associations called on FERC to make grid connection reform a top priority and reduce the backlog of projects waiting to be connected to the grid.
In April 2022, the new IEEE 2800-2022 standard was released, filling the gap in the specification of grid-connected large-scale solar-storage power stations in North America.
In October 2022, DOE launched a new plan, e-Xchange (i2X), which aims to help clean energy connect to the grid and improve grid reliability.
That same year, the Planning Commission had approved a simplified process for projects starting in 2024.
Because grid connection requires a lot of professional knowledge and capital expenditure, small developers are discouraged from the North American market due to lack of on-site grid connection experience.
Future Outlook
At present, the United States has taken a number of measures to clear the backlog of grid-connected projects, and it is expected to be implemented in the next 2-3 years. It is estimated that the energy storage market will increase to 44.2GWh and 68.2GWh in 2024-2025, and the CAGR will reach 59.5% in 2021-2025.